


Last week, we talked about bad causal design in electoral analysis. It’s much easier to criticize, so let’s instead turn to what good (or better) causal design looks like when asking election related questions.
Do inflation and real wages affect election outcomes? After several years of high inflation, it’s natural to wonder how elevated inflation impacts electoral performance. There are two hypotheses here:
Do voters care about real wages (wages adjusted for inflation)? – this is referred to as “pocketbook voting” with voters rewarding politicians when their real wages increase;
Do voters care about the price level? – this is referencing the idea that people simply do not like nominal high prices, regardless of whether their wages adapted.
Let’s dive in and also learn about some more important econometric limitations.
Key Takeaways
Real wage growth appears to positively affect ruling party vote shares, although the effect is quite small;
Higher inflation, when holding real wage growth constant, appears to increase vote shares for the ruling parties, but;
This does not necessarily mean voters like inflation; instead it may reflect higher economic dynamism;
Proper econometric analysis can give helpful answers but often to narrower questions, which makes determining the nationwide impact of inflation and real wage growth on voting difficult to estimate.

Nominal News is an economics newsletter written by a PhD Economist that translates the latest economic research into clear, policy‑relevant insights on current issues. Join 4,000 readers to stay-up-to-date with Nominal News directly in your inbox:
Real Wages vs. Inflation: What Drives Voting Behavior?
Riaño and Trebbi (2026) (“RT”) looked at U.S. elections during the 2020-2024 period. During this period, the U.S. experienced relatively high inflation, with prices cumulatively rising by more than 20%.
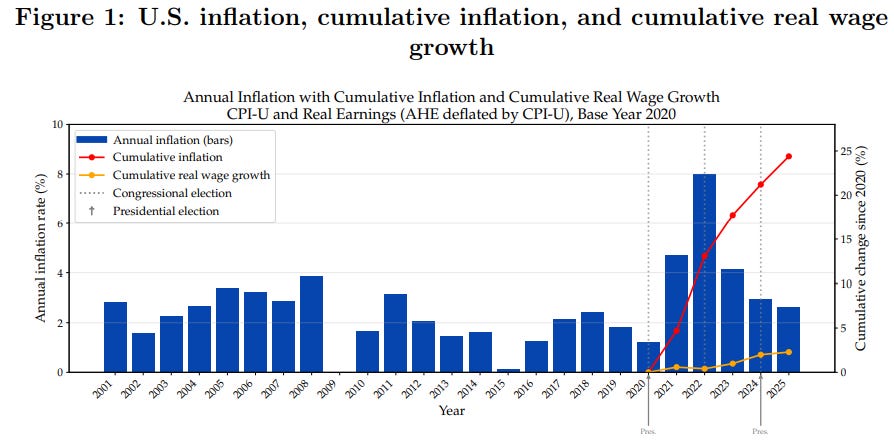
To determine the impact of real wages vs. inflation on election outcomes, RT used a regression approach. But unlike last week’s analysis, which looked quite broadly at election races, such as the Senate or House races, RT looked at county-level data, of which there are more than 3,000 in the U.S.
Measuring County-Level Inflation and Real Wages
Measuring Cost of Living: EPI Family Budget Calculator
RT collected county price data using the Economic Policy Institute (EPI) Family Budget Calculator (FBC). The FBC, unlike your typical measure of inflation, estimates the cost of a “modest but adequate standard of living” for a family of 4. Unlike a price index, such as the Consumer Price Index (CPI), it is more akin to a cost of living measure. The reason for the use of this data, rather than CPI, is data coverage – CPI is not measured on a county-level, and many rural areas are not covered by CPI.
Measuring Local Wages: BLS QCEW Data
For wages, RT used the Bureau of Labor Statistics (BLS) Quarterly Census of Employment and Wages (QCEW), which provides county level data on total wages earned in the county. One data concern here is that this does not control for hours worked – so if wages go up, it might be driven by either earning more per hour or working more.
Lastly, RT collected election data by county looking at the 2020 and 2024 elections, taking into account specific vote totals.
Why Economists Use Control Variables in Election Studies
RT add numerous controls – other variables that may explain electoral outcomes. If we do not include control variables, we might erroneously attribute the change in electoral outcome to the changes in inflation or real wage growth, when in fact the real ‘causal’ variable was another variable.
RT add the following controls in each county:
Share of land classified as urban;
Population density;
Median age;
Educational attainment;
Real GDP;
Demographic composition.
To belabor the point on why we need controls – let’s take educational attainment. If between elections, the share of individuals with a college degree in a county increases, we might observe higher wages, and perhaps, higher inflation. At the same time, if people with a college degree favor one party, we might see a change in voting. Without controlling for educational attainment, we might erroneously claim real wage growth changed electoral votes, when in fact, it was simply because more college educated people lived in a county.
Results: How Much Do Real Wages and Inflation Shift Vote Share?
RT found that real wage growth does matter for electoral outcomes – albeit very little. For a 16 percentage point higher real wage growth, the ‘ruling’ party can expect to get about 0.1 percentage points in voter share (e.g. if in 2020 you got 45%, in 2024, you’d get 45.1% of the vote). Typical real wage growth is 1-2% per year, so between elections you can expect around 4 to 8% real wage growth.
Regarding inflation, RT found an interesting result – holding real wage growth fixed, 8% higher inflation increases the ruling party’s vote by about 0.23 percentage points. What does this mean?
If County A has 12% wage growth and 10% inflation (i.e. real wage growth of 2%), while County B has 5% wage growth and 3% inflation (identical real wage growth), County A will have more people vote for the ruling party than County B. This pattern might be explained by the fact that County A is more economically dynamic (for example, more high paying jobs are being created in County A).
Generally, broader research has suggested that more dynamic, high growth economies have tended to vote more towards the Democratic party, which is why higher inflation suggested more Democratic party voting. Additionally, RT posit an idea that high wage growth and high inflation make the economy a topic of higher salience to voters. Observing frequent wage increases might make you more likely to vote for the ruling party, which, in the case of the 2024 election, was the Democratic party (though the Democratic party lost, they presumably would have gotten even fewer votes).
So can we answer whether real wages or inflation matter more? Unfortunately, once we understand the research design, we can see why this is hard to do.
The “Missing Intercept” Problem: Why First-Differences Miss National Trends
To be able to interpret the above findings in their proper context, it is important to have a good grasp on the research design.
The method used by RT relies on what is called “first-differences”. The process is as follows:
Measure the local shift: Look at the change in vote share of the ruling party between 2024 and 2020 for each county.
Account for county differences: Adjust for any differences between the counties (demographics, urbanization, etc.) by adding controls.
Compare shifts across counties: Compare the vote-share shifts from step 1 against how inflation and real wages changed in each county.
Because in Step 3 you compare counties to each other, anything that impacted all counties nationally (for example, media coverage) gets ‘differenced out’. So if, for example, national perception of inflation shifted everyone’s vote by 2 percentage points, then this method would not capture this impact – it only measures whether a county voted differently when it experienced higher or lower inflation than the national average.
This is often referred to by economists as the “missing intercept” problem – the intercept in this case refers to all the effects that impact every county in the same way such as media coverage, presidential approval, general voter sentiment and national inflation. By ‘differencing’, we simply subtract out the ‘intercept’ from our estimation, meaning we do not estimate if the ‘intercept’ changed. Using this methodology, we cannot estimate if inflation shifted voters nationally as this was ‘removed’.
Proper econometrics analysis allows us to isolate relationships more rigorously, but it sometimes prevents us from answering broader questions people may want to know.
Why National Economic Conditions Are Difficult to Measure
The reason RT were only able to explain a small amount of the observed electoral changes is that nationwide impacts are likely to be more influential than local county level differences. Unfortunately, there might not be a way to determine the nationwide impact of real wage growth and inflation on voting from a ‘causal’ perspective.1 This is the hard limitation of data.
How to Spot Bad Election Data vs. Rigorous Causal Design
Last week, we discussed analyses that relied on simple election outcomes and margins without carefully thinking about identification. We’ve recently been inundated by such shoddy ‘research’, especially charts like the one below that looks sophisticated, claiming far more than their research design allows for:
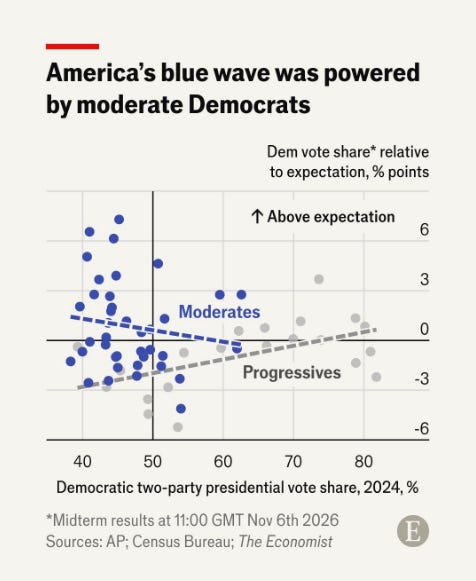
The lesson from the RT paper is that answering electoral questions requires a research design capable of isolating causal effects. Even then, the answers we obtain are often narrower than the questions we originally wanted to ask – a problem in many empirical studies.
However, thanks to the work by RT, we can say that real wage growth does impact electoral outcomes. Even though the impact might be small – 0.1 percentage points – in tight races, it may matter. The RT study suggests changes in real wages contributed to electoral shifts, providing some evidence against the view that economic conditions during that time period were disconnected from voting behavior.
Overall, conducting good economics is messy and takes time, but it allows us to answer questions much more rigorously.
Economics. Not Politics.
Appendix: An Example to Understand the Differencing Method
To introduce why ‘differencing’ works as a method of analysis, below is a visual example of a slightly different, albeit related, research design called ‘difference-in-differences’.
From Wikipedia, here’s a visual representation of difference-in-differences:
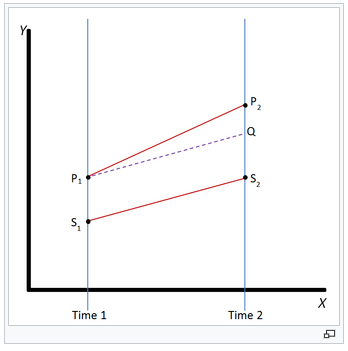
Assume P is the treated group (for example, a policy intervention in a specific county), while S is the untreated group (no policy intervention). Prior to the treatment in Time 1, the two groups already had a difference between outcomes: P1 - S1. After treatment, in Time 2, we observe P2 and S2. We look at this difference: P2 - S2. Lastly, we take the difference in these differences: (P2 - S2) - (P1 - S1). In our case, this equals P2-Q, which is the effect of the treatment on the outcome.
What this chart tells us, that if we had compared P2 to P1 without incorporating the effect of the untreated group S, we would have overestimated the impact of the treatment. The overestimate would be driven by the fact that something else was causing both P and S to generally increase, that’s not related to the treatment.
Most ‘difference’ based regressions rely on this sort of idea – we can remove the impact of other variables in our analysis, and isolate the pure impact of the treatment. In a broad sense, that is what RT do in their research design.
If you would like to support us in reaching our subscriber goal of 7,000 subscribers, please consider sharing this article and pressing the like❤️ button at top or bottom of this article! Sharing this article can earn you a free Paid Subscription.
In order to determine the impact of inflation on voting, you need variation in both inflation and voting. Since inflation may have a national effect that impacts all in the same way, we don’t have any variation. We would need to compare the impact of 2024 inflation on voting to the impact of inflation on voting in 2020, in 2016, etc. But since there are many other differences (candidates, overall economy, geopolitical situation) between elections, it is difficult to control for all these factors, especially as we have so few election observations (one election every 4 years).