
Inflation – a Short Primer
How staggered pricing causes inflation, even without money.

Thank you for reading our work! Nominal News is an email newsletter read by over 4,000 readers that focuses on the application of economic research on current issues. Subscribe for free to stay-up-to-date with Nominal News directly in your inbox:
Our updated goal for 2025 is to hit 10,000 subscribers:

If you would like to support us further with reaching our subscriber goal, please consider sharing and liking this article!

Today, we will do an inflation primer discussing what is inflation, why it is measured the way it is and what fundamentally drives inflation (spoiler: price conflict).1
For readers who want to skip the inflation primer, I recommend jumping to section III.
I. Inflation (with a capital I)
Inflation (with a capital I, or model-based Inflation) is the name economists have given to a particular variable found in economics models. Let’s briefly go over why the Inflation variable appears in models.
Consumption, Utility and Time
To create a model of the entire economy, economists first assume that individuals want to maximize some form of utility function (we can think of it as someone trying to maximize happiness). In the most basic form, the main input into this utility function is ‘consumption’. ‘Consumption’ is usually assumed to be a combination of goods and services that an individual consumes, which is why it is often referred to as a ‘consumption bundle’.
Inside this model, each of the goods and services is produced by a firm. The output of each firm – how much of a good or service is produced – is guided by its own production function. Each of the firms sets a price for what they produce (note – each firm provides a unique good/service). Since the ‘consumption bundle’ is an aggregation of these goods and services, a price for this ‘consumption bundle’ can be computed, as a function of the prices of the goods and services that are in the ‘consumption bundle’.
This model also has a time component or ‘time period’ as economists often refer to them. Thus, the change in price of the ‘consumption bundle’ from one time period to another is referred to as ‘Inflation’. This Inflation (with a capital I) is a model variable.
II. Measuring Inflation
The model described above has natural parallels to the real world. Economists became interested in attempting to measure this model based Inflation in the real world. However, it’s clear that measuring Inflation will not be simple because there is no such thing as a ‘consumption bundle’ in the real world. Each person consumes different things. Therefore, certain assumptions need to be made about what is the ‘consumption bundle’ and how to actually measure it. Some of the assumptions are which type of individual we should focus on (most measures focus on urban individuals), which particular goods and services should we consider and how important in the ‘consumption basket’ is each good/service.
For this reason, there are different inflation (small i, or data estimated inflation) measures that aim to get at Inflation (capital I).The key inflation measures we often hear about in the US are:
Consumer Price Index (CPI) – this is what is most commonly referred to as the inflation measure. It is usually announced soon after month end in the US. CPI is measured by the Bureau of Labor Statistics (BLS). The CPI measure focuses only on urban populations and their out-of-pocket expenses. The CPI measure is created by conducting a survey of consumers, asking them where and how much they spent on buying certain goods. The goods on which the CPI focuses are pre-selected earlier, using a so-called typical ‘basket’ of goods. This basket is fixed for a period (typically 2 years). This creates an issue – it may occasionally overestimate the true increase costs, because it does not take into account substitution effects – for example, if apples become expensive, consumers might buy more oranges instead. Their overall spend on food might remain the same (no inflation), but CPI will show an increase in price because of higher apple prices.
Personal Consumption Expenditure Price Index (PCE, or more accurately, PCEPI) – this is an inflation measure constructed by the Bureau of Economic Advisors (BEA). This inflation measure is more often used by the Federal Reserve (US central bank) when making policy decisions. The PCE collects spending data from both urban and rural populations. It also looks at expenditures conducted by third-parties on behalf of consumers – for example, health-care spending undertaken by employers. The last key difference between the CPI and PCE is that the ‘basket’ of goods used for this measure is constructed based on surveys of businesses and what they sold in the current month. This basket, therefore, can fluctuate rapidly. This is then used along with the survey data on out-of-pocket expenses of consumers collected by the CPI. This measure deals with some of the issues of the CPI, as it can capture the fact that people substitute goods. Another benefit is that the ‘basket’ is more likely to be a true representation of what goods were sold during the prior month. Consumers may under-report how much they spend on ‘vices’ such as alcohol and tobacco in surveys, while businesses have no incentive to give false data. The main drawback of the PCE is that it takes much longer to collect accurate data. Even the first PCE release, which comes nearly a full month after the CPI data, can end up being amended later.
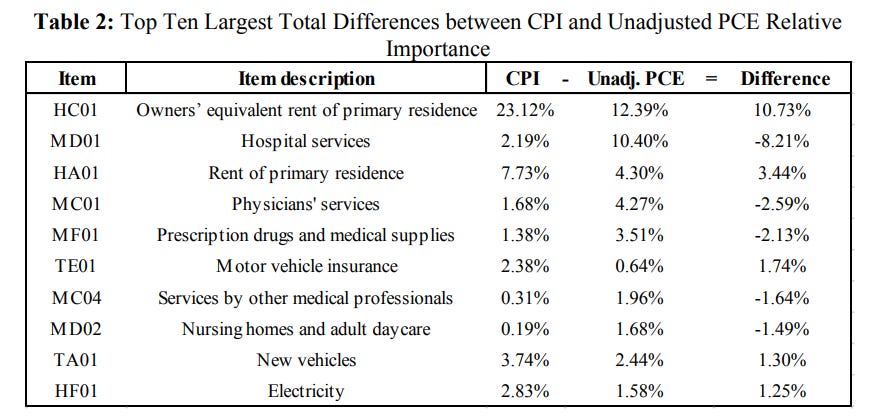
To demonstrate how different these measures are, here is a summary of the key weighting differences between CPI and PCE (Source: BLS):
Now to further complicate issues, CPI and PCE are sometimes presented in their ‘Core’ version. Core CPI and Core PCE strip out energy and food spending from the basket, and therefore those items are not included in the inflation measures.
Ultimately, the reason there are different inflation measures is because we cannot be 100 percent certain which of the measures is appropriately representing model Inflation. Moreover, there’s no reason that one measure is always superior to another all the time. This is why there are many debates and discussions around the measures, which even we have written about, especially focusing on how to interpret the shelter component of the inflation measures.
The next section illustrates how each of the measures can give quite a different view on the inflation rate.
III. Inflation Measures in Action – US Inflation
Below is a chart of the recent US inflation data – where we show the CPI measure, the PCE measure, the CPI measure without shelter and the HICP (the Harmonized Index of Consumer Prices), which is the inflation measure used in Europe that also places less weight on shelter.

As can be seen in the chart, the two measures, CPI without shelter and HICP, show inflation being back at the 2% target for most of 2024, while the other two measures, especially CPI, show elevated inflation. These different measures can lead to very different thoughts on how a central bank should respond, which is why understanding the differences amongst the inflation measures is important.
IV. Inflation as Conflict
Ultimately, beyond just focusing on how to measure inflation, it is important to also understand what drives inflation. The history of economic thought on this topic is quite interesting (this Wikipedia article gives a succinct summary). The original debate on inflation focused on whether inflation is purely a ‘monetary phenomenon’ (i.e. based on the supply of money in the economy) or not (i.e. if fiscal policy, such as tax policy and economic stimulus, can impact inflation). The former belief was famously described by Milton Friedman – "Inflation is always and everywhere a monetary phenomenon."
Lorenzoni and Werning (2023), however, showed that, regardless of one’s beliefs whether inflation is primarily a monetary phenomenon or not, one element is crucial – ‘conflict’.
Conflict
Lorenzoni and Werning (2023) showed the ‘conflict’ that causes inflation by looking at a world with no money, making any solely monetary views of inflation unlikely to be correct. The model is intentionally stylized to elucidate the mechanism.
The Model
We have two agents in our economy – Sven and Kristoff. Sven gets 10 carrots everyday while Kristoff gets 10 apples everyday. The number of carrots and apples each gets every day is fixed and cannot be changed. The carrots and apples cannot be saved in any way and must be consumed on the day. Both Sven and Kristoff like both apples and carrots. They get utility from both and may prefer a mix of both over just having carrots or apples.
On the first day, both the carrot and the apple start with a value of 1, meaning 1 apple is equal in value to 1 carrot. We can think of this as a price, but note this number is not money – just a number reflecting value. On the first day, and all subsequent odd days, Sven gets to set the price for the carrot. For example, if Sven sets the price at 2 for a carrot, Kristoff would have to give up 2 apples to get 1 carrot, since the ‘price’ of the apple is 1.
After Sven sets the price of carrots, Kristoff tells Sven how many apples he’s willing to trade for the carrots at the price Sven stated. This is a ‘take it or leave it’ offer to Sven. Thus if Kristoff says – here’s 4 apples, Sven can either accept it and give Kristoff 2 carrots or reject the deal. After any trade, both Sven and Kristoff consume all their apples and carrots.
On day 2, and on all even days, Kristoff can set the price of apples (say he chooses 4, meaning 1 apple is now worth 2 carrots since the price of carrots is 2 based on the previous price set by Sven). The price of carrots stays the same as the price Sven set on day 1. The exact same mechanism as described above repeats itself with Kristoff stating the price for apples, and then Sven telling Kristoff how many carrots he’s willing to give up.
As can be seen in this setup, both Sven and Kristoff will keep increasing the stated price of their respective goods on the day each of them gets to set a price. The change in price of carrots (and apples) is inflation. It’s worth reiterating – there’s no money in this model, no money supply and no central bank. Yet inflation is still occurring.
The key mechanism needed for this result to occur is staggered pricing between parties. In this example, the crucial assumption is that Sven can set the price on odd days, while Kristoff sets them on even days. This staggered pricing mechanism creates ‘conflict’ and generates inflation.
Staggered Prices – the New Keynesian Model of the World
The staggered pricing assumption has been considered to be a decent reflection of reality. Firms often set prices and keep them fixed for a period of time. In the meantime, workers negotiate wages with firms, which are also often set for a period of time. This staggered pricing assumption is found in New Keynesian models of the economy.
The key ‘conflict’ in a model of the real world can be simplified to two parties:
the firms that set prices and want to earn a desired profit (or desired mark-up);
workers, or labor, want a specific level of real wages.
These real wages impact the real marginal cost of production of the firm – how much it costs to produce one more unit of a good (for example, for a car manufacturer, this would be the cost to produce one extra car).
If real wages go up, firms that are targeting a desired mark-up, will increase prices. That is how Inflation is tied to the real marginal cost and level of desired mark-up (targeted profits). To see how this model works out numerically, please see the Appendix below (we used this example in our previous post).
One last element that impacts Inflation is based on ‘Inflation expectations’. The above ‘conflict’ between firms and workers is anticipated between the two parties. Firms know workers will demand higher wages, while workers know that firms will set prices higher (increasing Inflation). Since firms and workers are usually assumed to be rational, both firms and workers have an expectation of future Inflation. This also feeds into their decisions when setting prices or demanding wages.
Thus, the New Keynesian model tells us that Inflation is related to the:
real marginal cost;
the level of desired mark-up; and,
Inflation expectations.
Resolving the Conflict
Central banks can ‘resolve’ the conflict to keep inflation at a specific target, by adjusting interest rates. Increasing interest rates, slows down the economy, as it makes creating or expanding businesses costlier. This in turn reduces labor demand, increases unemployment, which weakens the bargaining position of workers, reducing the real wage workers can demand in their negotiation. In turn, this reduces the real marginal cost, which reduces inflation.
Using the Framework
The purpose of any model is to inform us what will happen under different scenarios. To me, the New Keynesian model currently appears to explain inflation dynamics most appropriately. I have used the framework during the recent inflationary period in the US and the world. It can also be applied when thinking about impacts of other policies. For example, the imposition of large tariffs would most likely increase the rate of inflation, as tariffs increase the real marginal cost of production. In turn, since the Federal Reserve (the US central bank) wants to keep an inflation target of 2%, interest rates would be increased or kept higher for longer. This would weaken workers' bargaining position, reducing real wages.
Interesting Reads from the Week
Article: Mike Konczal discusses some of the recent criticisms of the economic policy of the previous US presidential administration.
Article: Keshler Thibert sits down with the former President of Guyana and discusses a wide range of topics inlcuding the post-colonial period, how the electoral system can promote racism and the intricate world of politics of Guyana.
Article: In the theme of today’s topic – Alpha in Academia discusses a recent paper on the impact of tariffs on inflation. From the article:
“… 25% tariff on Canada and Mexico combined with a 10% tariff on China, … could add 0.8 percentage points to core inflation, …[while] a 60% tariff on China plus a 10% tariff on all other imports, … could raise inflation by up to 2.2 percentage points.”
Appendix
Example – Normal Times
Now let’s illustrate how a level change in real marginal cost can permanently increase the inflation rate. We will use a simplified model, where 1 worker works for a firm and produces some product.
Suppose a worker works 10 hours to make 1 unit of the product. The firm pays the worker $100. Let’s also assume that the price level (the value of the goods the worker consumes – like a basket of groceries) in this economy is coincidentally also $100. This means the worker can afford to get 1 unit of consumption (or 1 basket of groceries). This is the worker’s real wage.
Let’s assume the firm wants a 10% profit. Therefore, since their cost to produce is $100 (the workers wage), the firm will charge $110 for their goods tomorrow. Since this is the only firm in this model, the price level tomorrow will also be $110. Since the firm produced the same amount of goods (just 1 unit), the move of the price from $100 to $110 is inflation – in this case 10%.
What happens next? The worker now sees that the price level is $110, but their salary was $100. This means they can only consume 0.91 of the consumption basket. That would mean their real wage went down. Naturally, the worker still wants to consume 1 unit of the consumption basket and thus demands a wage of $110. The firm’s costs are now $110. Repeating the cycle, the firm wants a 10% profit, so it will raise its price to $121. This is again another 10% increase in the price level, meaning a 10% inflation rate is maintained. This is how inflation persists in normal times.
Example – Supply Shock
Let’s go back to the beginning. Suppose something made production harder – the worker now needs 11 hours of work instead of 10 hours to make the product. This is a real cost change, as it now takes more time to make the product. Since the worker is working longer, they will not want $100, but say $110. In real terms, they will now be able to consume 1.1 consumption baskets since the price level was $100. The firm’s costs are now $110 instead of $100.
The real marginal cost is higher. The firm still wants the 10% profit, so it will charge a price of $121 tomorrow. Since the price level went to $121 from $100, inflation was 21%. What happens next? The worker now still wants to get 1.1 units of consumption. So the worker will demand $133, since $133/$121 is 1.1. But since the firm’s costs are $133 and they want a 10% profit, they will now charge $146! So the price moves from $121 to $146 – a 21% inflation rate! Thus, a one time shock to the real marginal cost increases the inflation rate permanently from 10% to 21%!
This topic was also inspired by one of our reader’s comments.
The staggered pricing model is the clearest explanation I've seen of why inflation persists structurally — it's not aberrant, it's baked into the negotiation sequence. What the model also shows, without quite saying it, is that the only current resolution mechanism (interest rates) resolves the conflict by depressing one side. The question the model doesn't answer is whether there's a way to anchor both sides to something common — so the conflict doesn't have to keep restarting.
Sven and Kristoff are interesting, but only one aspect of the causes of inflation. For example, the deflation of the late 1800’s follows nicely from monetary explanations (the gold supply did not expand fast enough to keep up with production growth), as does the long inflation of the 1500s and every hyperinflation I have seen investigated.