


Nominal News is an economics newsletter written by a PhD Economist that translates the latest economic research into clear, policy‑relevant insights on current issues. Join 4,000 readers to stay-up-to-date with Nominal News directly in your inbox:
Although today’s article might seem unrelated to economics, the main idea touches on data collection and interpretation, as well as how to use data properly. In economics, we often hear criticisms that ‘data is incorrect’ or that data releases are being politically manipulated. Similar accusations have fallen on election polling with claims that it, too, is being manipulated. As is the case with economic data, polling is also often misinterpreted. In today’s article, in anticipation of the U.S. midterm elections, after which I am sure we will see headlines claiming that “the polls lied”, I want to explain how polls should be interpreted, and why their results differ from what happens on election day.
More importantly, I want to defend the integrity of polling and pollsters, who are judged on the wrong criterion – how accurately they predict election margin. As polls are not meant to do that, evaluating them based on election margin is misguided. Yet it continues to happen, as illustrated below with the recent New York Times’ discussion about “polling misses”:
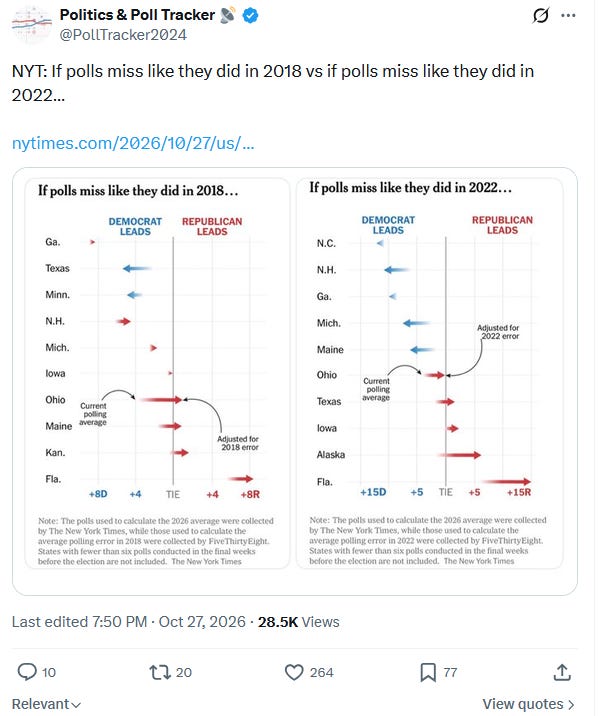
The problem with this approach is that, when the public ‘grades’ pollsters by how closely they match the election margin, pollsters are incentivized to drop proper polling methodology and instead focus on ‘guessing’ the polling margin. This may already be happening with pollsters potentially engaging in ‘herding’, a phenomenon that may be driven by how we evaluate pollsters. Pollsters should not be judged by the election margin, which is the domain of forecasters. Instead, they should be evaluated on whether they followed proper polling methods.
I will use the recent Brazilian election to illustrate the difference between polls and forecasts.

Brazilian Election
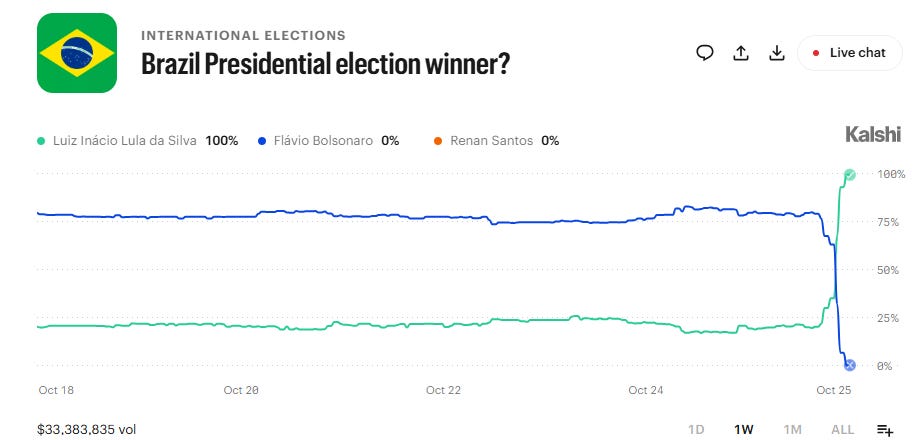
Brazil recently held presidential elections. The result surprised many, with the incumbent candidate, Lula, winning. Below is what “prediction” market participants at Kalshi thought would happen, with opposition candidate Bolsonaro having a 75% chance of winning before election day.
As is the case, polling has come under scrutiny:
”No wonder pollsters said a Lula victory was almost impossible,” said Thiago Vidal, a political analyst with Prospectiva consultants.”
If we ask an AI for its opinion:
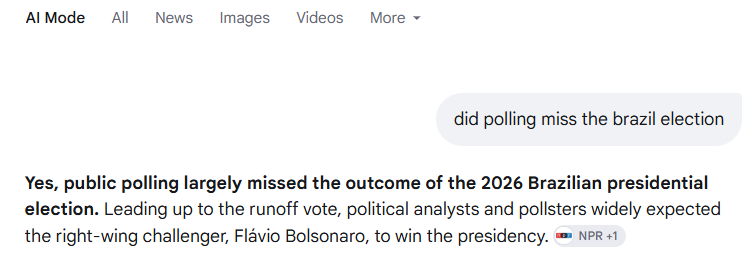
The Brazil election is a useful case study in why the polls were right, but our interpretation of them were wrong (or at least based on incorrect assumptions).
Using Polls For Forecasting
The Brazilian electoral system has an interesting feature: if no candidate receives more than half of the vote, a run-off between the top two candidates is held. This is what happened during the Brazilian presidential election.
The First Round
Let’s scale the total voting population of Brazil (around 128mln)1 into 1,000 people. Polls of the first round showed approximately the following breakdown:
400-450 people voting for Lula
400-450 people voting for Bolsonaro
70-140 people voting for other candidates
60-130 people voting ‘undecided’
The actual results were:
420 voted for Lula
437 voted for Bolsonaro
72 voted for others
47 voted “blank”
23 did not come out to vote in the first round
If we look at this first round result, it appears that the polls captured voting intentions quite well.
At the same time, it’s worth noting that the final result of the first round was presented as:
45% for Lula
47% for Bolsonaro
8% for others.
That’s because, in looking at actual election results, only votes cast for a candidate are included in the denominator versus in polls, blank votes and no-shows are counted. Looking at the actual results and comparing them with the polls makes it seem like there was a “polling miss”. Bolsonaro got a larger share of votes than the polling suggested. However, presenting the results without the ‘other’ voter groups removed valuable information and shifted perceptions of the second round.
The Second Round
When forecasting the second round, many (including me) relied on the official results. With a 45-47-8 split, and the fact that the third party candidates’ platforms appeared to align more with Bolsonaro, it was easy to forecast that Bolsonaro would win the second round.
Even under a 50-50 split of the third party votes, Lula would receive 49%, while Bolsonaro would get 51%.
Come election day, the following happened:
501 voted for Lula
466 voted for Bolsonaro
33 voted “blank”
So what changed between the first round to the second round? Lula ‘gained’ 80 votes, while Bolsonaro ‘gained’ 29 votes. Where did these votes come from:
37 were new voters (which for simplicity, we can assume all went to Lula)
The 72 third-party voters split, 43 voting for Lula, 29 voting for Bolsonaro (equivalent to a 60%-40% split in favor of Lula)
Interestingly, if we return to polling data, the initial forecast that I presented may have been unjustified:
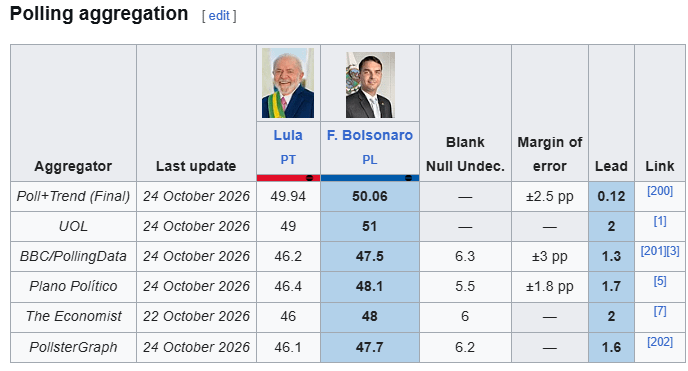
The aggregates that included the blank/undecideds (a crucial piece of information) were quite accurate. Polls were suggesting:
460-470 voters for Lula
470-480 voters for Bolsonaro
55-65 voters that were undecided.
It turned out that on election day, more than half of the undecideds voted for Lula, which perhaps isn’t surprising. If we assume that the undecideds were voters who were dissatisfied with the incumbent Lula, they may have been reluctant to support Lula in a poll. Yet, come election day, faced with a choice of Lula or Bolsonaro, they picked Lula.
Polling provides us with the information, but the challenge was converting polling information into a forecast. Using polling margin and even the first round election margin to forecast the second round election outcome turned out to be a poor, unjustified assumption. A more rigorous analysis would involve modeling how third-party voters and the undecideds would behave in the runoff.
Applying The Method to US Midterm Elections
I’m not an election forecaster, but guessing what will happen on election night is a topic that often comes up in social settings. So if we were having a beer, here is how I would think of some of the upcoming US elections.
South Carolina
Here is the polling data as per Nate Silver:
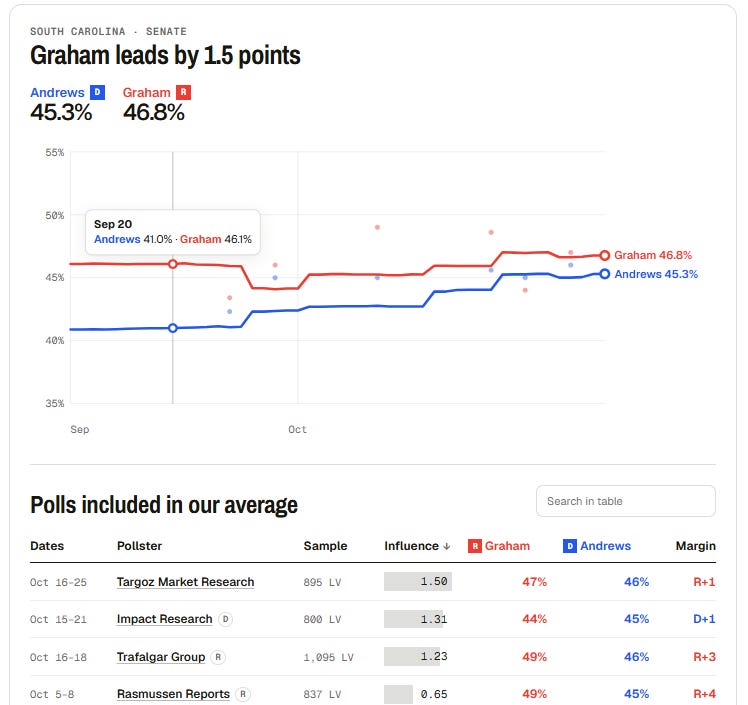
The race looks close. But is it really? Around 8% of voters are either voting third-party or undecided. How are these third-party/undecided voters likely to split? In the 2020 senate election, the Republican candidate won 54-44, while in the 2024 presidential election the results were 58-40 in favor of the Republican candidate.
Based on that history, my prior is that a significant share of the 8% undecided voters are likely to be Republican-leaning who perhaps are dissatisfied with their party. Come election day, I would forecast most of these individuals to vote Republican. So the election outcome might be much closer to 51-46 for the Republican, which would mean that this race isn’t ‘close’ at all.
One thing of note is that the above chart uses language which I think is problematic – the top of the graph says “Graham leads by 1.5pts”. The problem is that the real lead may be 5pts, making the chart headline incorrect.
Minnesota
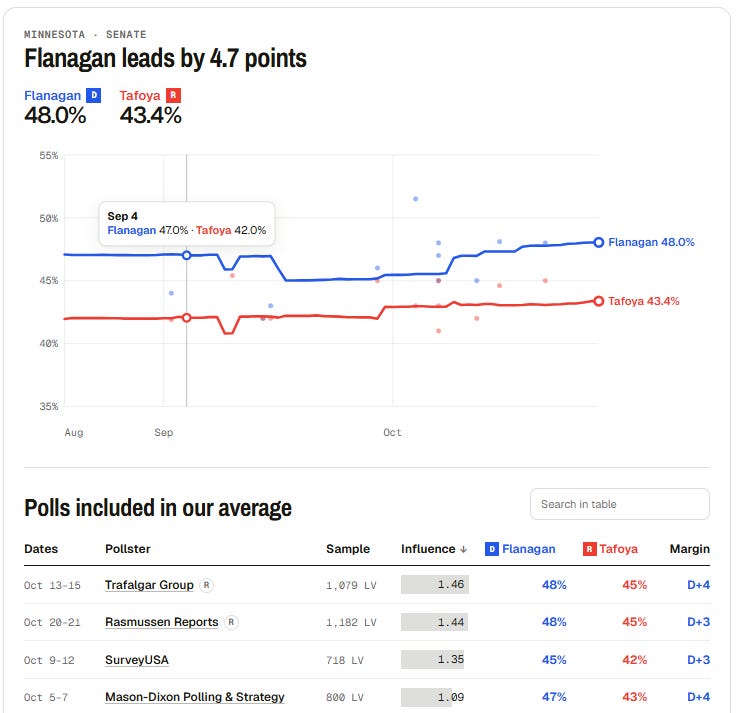
Here we have another ‘close-ish’ race (often discussed in the media). Once again, we have a large number of third-party/undecideds at 9% with no candidate reliably polling above 50%. The 2020 senate election was 48-43-5 (Democratic-Republican-Legal Marijuana Now), while the presidential election was 51%-47% for the Democratic candidate. Similar to South Carolina, my assumption is the undecideds are dissatisfied with the incumbent Democratic party, but come election day, will vote for the Democratic party. Thus, a 52%-43% in favor of the Democratic candidate could be very plausible, meaning the lead is actually 9 percentage points.
Kansas Elections
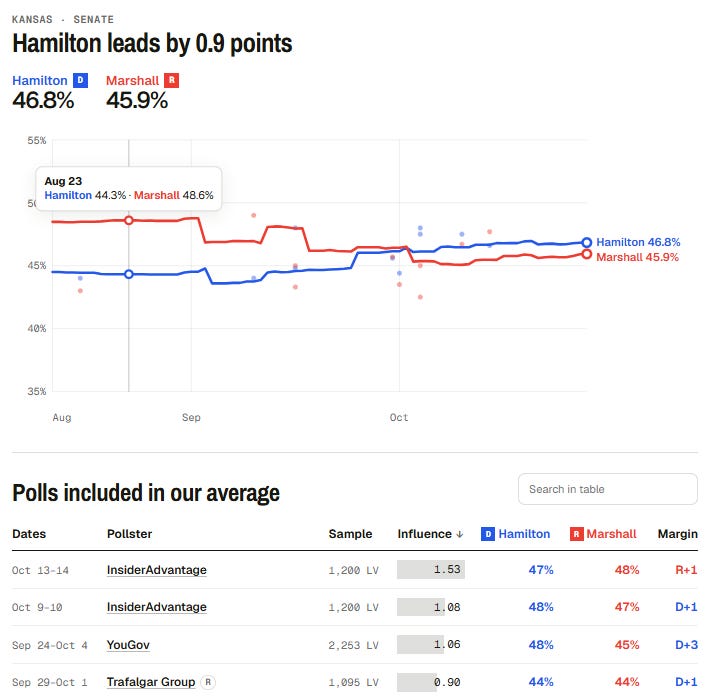
Kansas is a bit more interesting than the other two states – so let’s work through it a bit more formally.
Let’s assume there are 1,000 voters. In the recent presidential elections:
c.560 voted for the Republican
c.410 voted for the Democratic
c.30 voted for other/write-in/blank2
During non-presidential elections, typically the number of people coming out to vote falls by about 25% (most recently in 2022, the Democratic candidate saw a 30% reduction in turnout, while the Republican candidate saw a 20% reduction).
Polls typically focus on “likely voters” – so the individuals that are most likely to vote. Thus, in a typical year, if we assume a 25% vote reduction:
420 would vote Republican (56%)
310 would vote Democratic (41%)
20 would vote other/write-in/blank
250 would sit out (140 Republican voters, 100 Democratic voters, 10 other voters).
Polls currently suggest the split is different. One explanation could be that more Democratic voters say they will vote, while Republican voters are a bit more hesitant than before, for example:
360 say they will vote Republican (46%) (40 voters are now ‘undecided’, while 20 will sit out)
370 say they will vote Democratic (47%) (60 voters who previously sat out, will now vote)
60 say they are undecided.
So the election outcome depends heavily on how the ‘undecideds’ will vote, especially the former 40 voters. As they are likely to be Republican voters, it’ll come down to whether they will abstain or vote Republican, as it is unlikely they would vote for the Democratic candidate.
It is very plausible that 30 of the 40 undecided voters come out and vote Republican, while perhaps more Democratic voters will sit out. An election night could look like:
390 vote Republican; (51%)
360 vote Democratic; (47%)
20 vote for other
News headlines will call it a ‘polling’ miss by 5pts, but that’s because everyone assumed the undecideds will split evenly, while actually 75% voted for one party, while the remaining sat out.
Ignore Polling Margins
My key takeaway here is that we should not rely on polling margins. Just as importantly, we should not criticize polls for our own forecast mistakes. The polls are a source of data, which we feed into our mental models (as I did in the examples above). They are not specific election forecasts.
Before we criticize any data gatherers, whether polls or economic data by institutions like the BLS, we should first evaluate whether we are interpreting what the data tells us correctly. In most cases, the interpretation is wrong rather than the data.
My rules of thumb for interpreting polls are:
If polls consistently show a candidate getting above 50%, then the candidate is almost guaranteed a win;
If polls consistently show a candidate in the high 40s (47%+) and there are at least 6% undecided, the candidate has a very high chance of winning come election day;
Anything below 47% (regardless of “lead”) is unknown and would require a deep dive to forecast the outcome.
If you would like to support us in reaching our subscriber goal of 7,000 subscribers, please consider sharing this article and pressing the like❤️ button at top or bottom of this article!
The total eligible voting population is 158mln, but for the purposes here, let’s assume 30mln never vote.
Kansas does not provide write-in data in an easy format - this estimate is based on a check of one county which accounts for 25% of the total vote.
I think your methodology is solid. If a candidate consistently polls 50+%, then we should have confidence in the frontrunner. If no one has 50+%, then for an upset, the question is if the undecideds will stay home or vote their party. Where there is a particularly uninspiring candidate (Paxton in TX or Graham in SC), the hope of the upset is that the undecideds stay home.
We should assume few will switch parties at the last minute. So look at the undecideds, not the margin.
Your data is a bit stale in the KS Senate. 3 polls were released in the past week: WaPo 54(D)-44(R); Emerson 50-47; CNN 49-45. So I think the Democrat may win KS. There are also 3 new polls out for the SC Senate race, but Andrews (D) never gets over 48%.