
Are People Really Less Conscientious?
A Financial Times article claims people have become less conscientious, but a closer look paints a more complicated picture.

Thank you for reading our work! Nominal News is an email newsletter read by over 4,000 readers that focuses on the application of economic research on current issues. Subscribe for free to stay-up-to-date with Nominal News directly in your inbox:
If you would like to support us in reaching our subscriber goal of 10,000 subscribers, please consider sharing this article and pressing the like❤️ button at top or bottom of this article!
Last week, we discussed how to avoid ‘click-bait’ economic headlines by focusing on 3 questions:
What can the metric tell us?
Is the value of the metric presented in an appropriate context and with other relevant data?
Hypothetically, what would we expect the value of this metric or data to be?
Or the more direct framing of these questions:
Why are we looking at this data?
Did the authors explain the data?
Is the data unexpected?
Let’s use these questions on an article that had significant buzz recently:
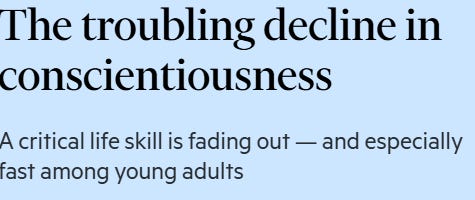
Are Younger Generations Becoming Less Conscientious?
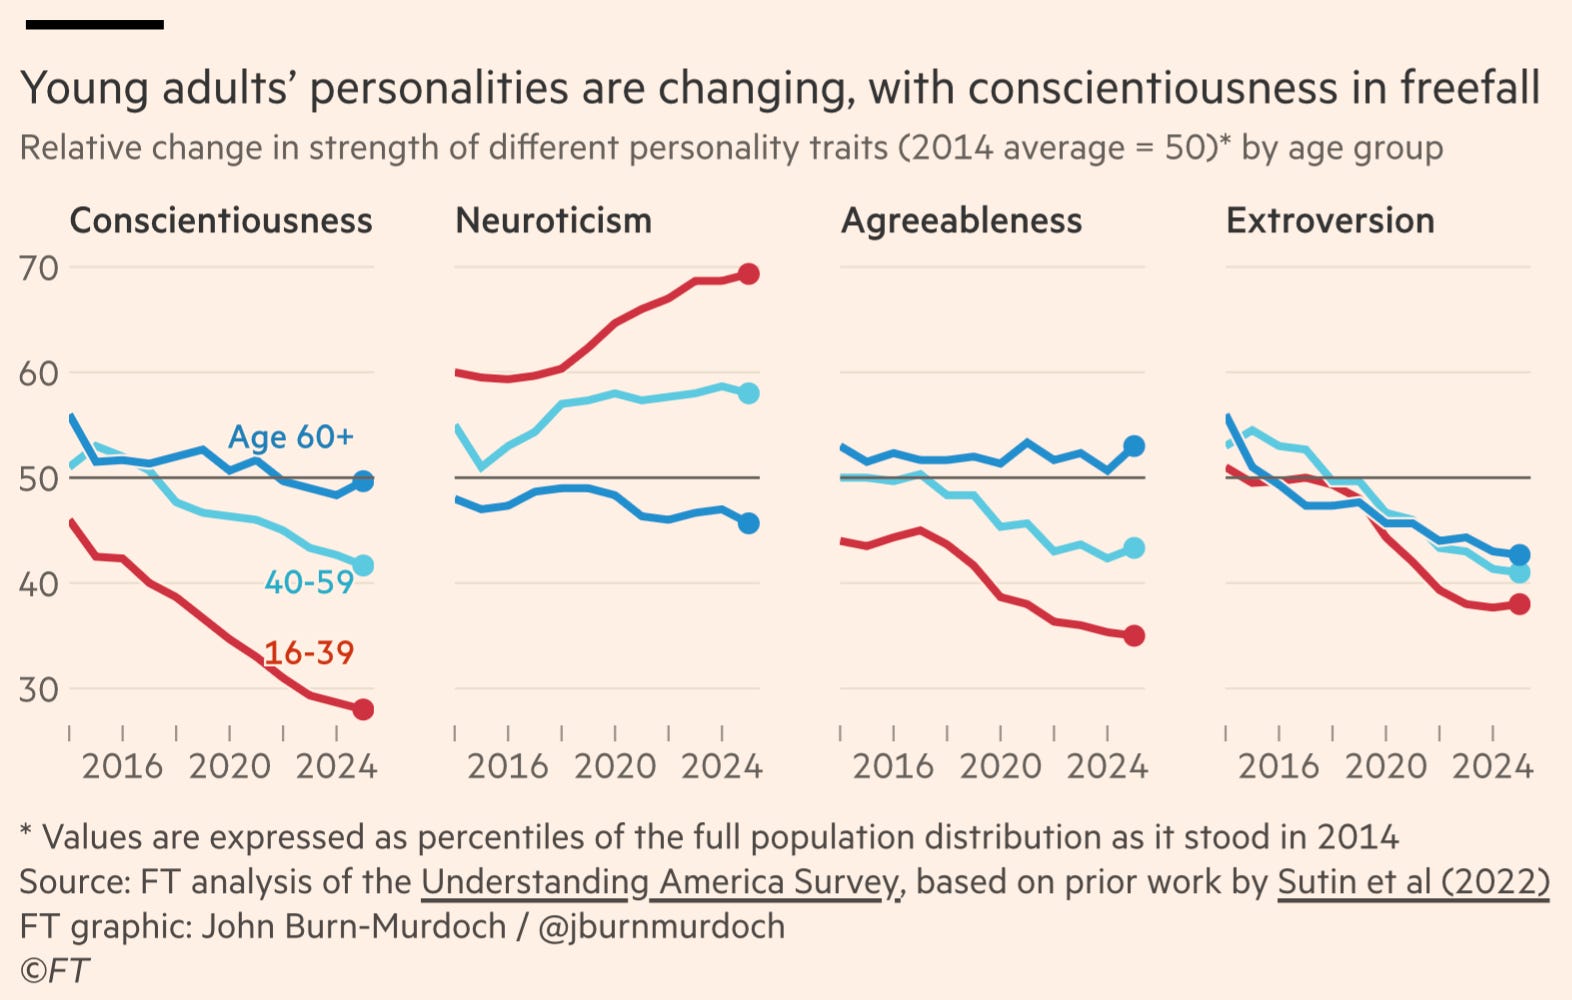
The Financial Times ran the above headline using the following chart that plotted conscientiousness, neuroticism, agreeableness and extroversion.
Question 1: What can the metric tell us?
The above four metrics are taken from survey-based questions focusing on several personality traits. The first concern that pops up to me is that this is a survey. Generally, surveys are poor methods of gathering data, because survey participants do not have any incentive to be accurate and truthful in their response. Moreover, given the subjectivity of these questions, I am skeptical whether just asking people about their personality can lead to a true reflection of their personalities.
To be clear, it is not that surveys have no place, but I would not draw important conclusions from any survey. Thus, my first reaction is skepticism.
Question 2: Is the value of the metric presented in an appropriate context and with other relevant data?
Each of the personality traits are presented in the charts over time, with conscientiousness appearing to dramatically fall for the 16 to 39 age group. The way the data is presented is described as follows in the chart:
“Values are presented as percentiles of the full population distribution as it stood in 2014”.
I don’t understand what this means (if you do, feel free to drop a comment below). A convoluted way of presenting data, raises a red flag for me – a metric shouldn’t be very difficult to understand. Why isn’t the change in the self-reported personality traits shown, but rather a form of percentiles analysis? (I did dig into this out of curiosity and in the end of the article, I explain why I think this was done)
The Financial Times piece does include other data in their analysis. Besides the above chart, the author presents other self-reported survey data on behaviors such as the following:
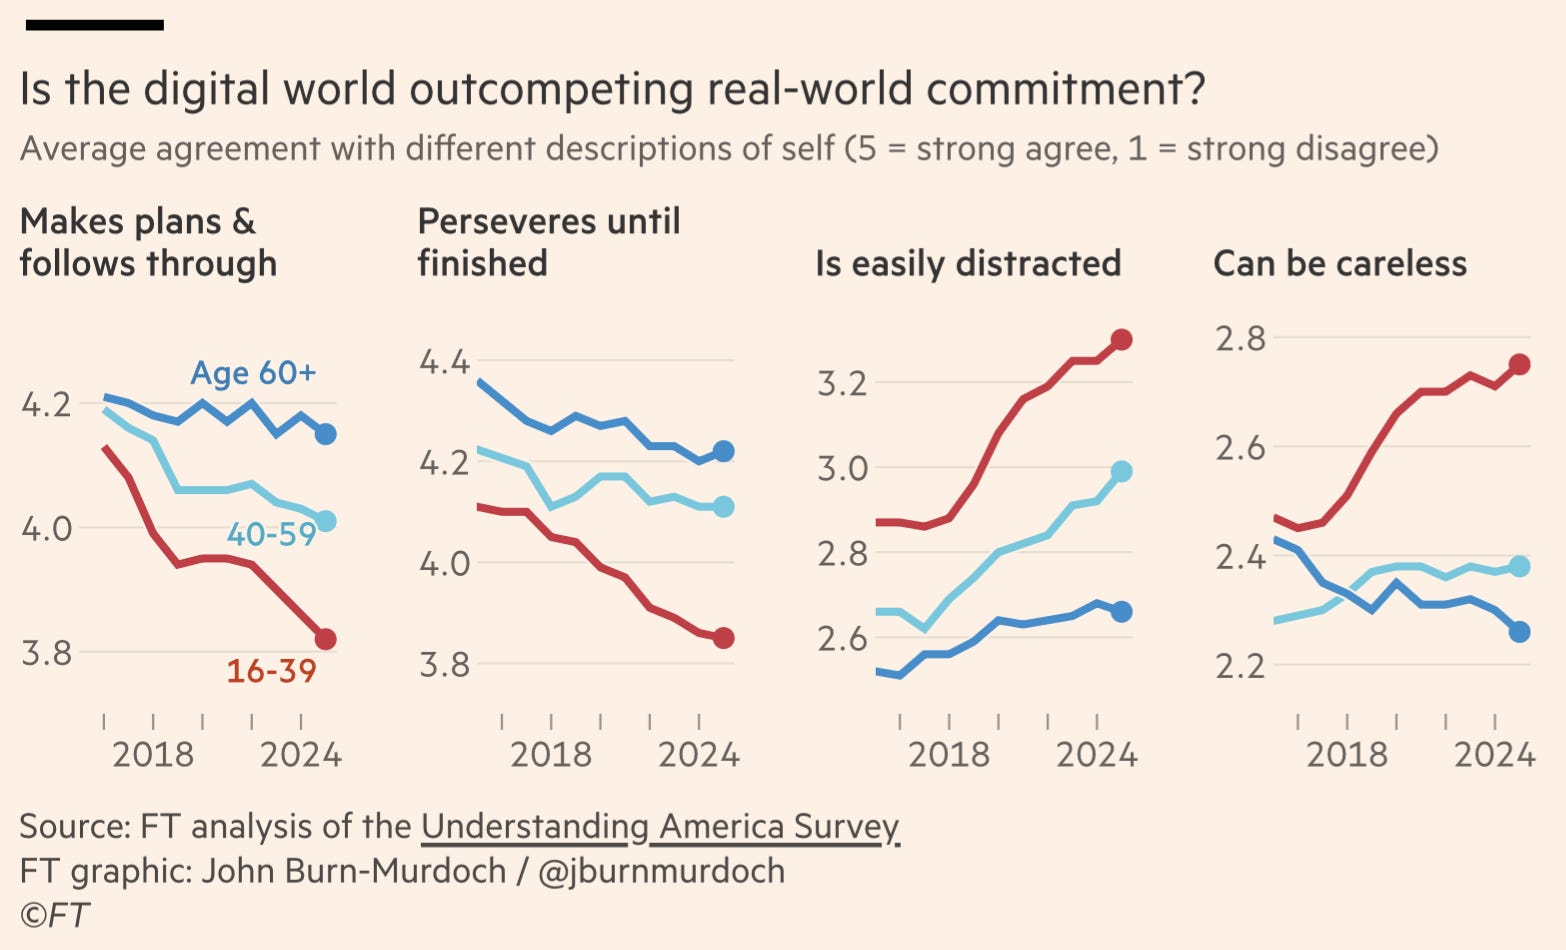
This information is helpful and relevant, albeit the fact that these are surveys still present the same limitations. However, as can be seen in the above graph, it is unclear to me if the changes are truly significant. Is a move from 4.1 to 3.8 in the first chart very meaningful in any sense? Could the 16 to 20 year old that have entered the survey in the latter year (2020 to 2024) simply respond to these questions differently? How much of these answers are driven by the wider media narratives?
Question 3: Hypothetically, what would we expect the value of this metric or data to be?
I do not know what values these personality traits should take. Moreover, the Financial Times piece also does not discuss whether the observed values or changes in personality traits were in any way expected. This is another weakness in the analysis – the reader is given no reason as to whether any of the numbers actually mean anything.
Final Assessment
From the 3 questions above, the conclusion is pretty clear that this Financial Times piece does not demonstrate that there has been a ‘troubling decline in conscientiousness’. The data used is not clear nor is its presentation. Moreover, we are given very little context of the issue of personality traits. Thus, personally, I would disregard this article – it is not a meaningful source of information for the issue it attempts to address.
Using the 3 Questions
My post today was meant to show how I use my 3-question approach to any data-based headline in a topic in which I have little knowledge. Normally, my approach to reading articles is not this lengthy – I typically skim the article to see whether the article answers the 3 questions:
Why are we looking at this data?
Did the authors explain the data?
Is the data unexpected?
If it doesn't – then the article is probably not worth my or your time.
P.S. Deeper Dive
I got curious why the data presentation in this article was so weird, so I looked at the underlying sources to try to get a better understanding.
The main paper cited in the Financial Times is Sutin et al (2022). Sutin et al. found that post-pandemic there was a decline in extroversion, openness, agreeableness, and conscientiousness. The size of this decline, however, was very small – one tenth of a standard deviation. To try to put it into context, if you could rank 20 of your friends based on conscientiousness, a 0.1 standard deviation decline is if your 10th most conscientious friend became your 11th most conscientious friend. Using a different context, it's as if an average person’s height was reduced by 0.3 inches (0.7cm).
However, Sutin et al. do point out that people’s personalities do not change much – a 0.1 standard deviation change in personality normally takes around 10 years to materialize. Nonetheless, it appears that, although these personality changes may be statistically significant (i.e. there is a recorded change), they appear to not be economically significant (i.e. this change does not have any meaningful impact).
Understanding America Survey
I further investigated the original data used for the analysis, as I was curious to see if I could replicate the chart. Using the data visualization present on the site, here is the conscientiousness yearly trend:
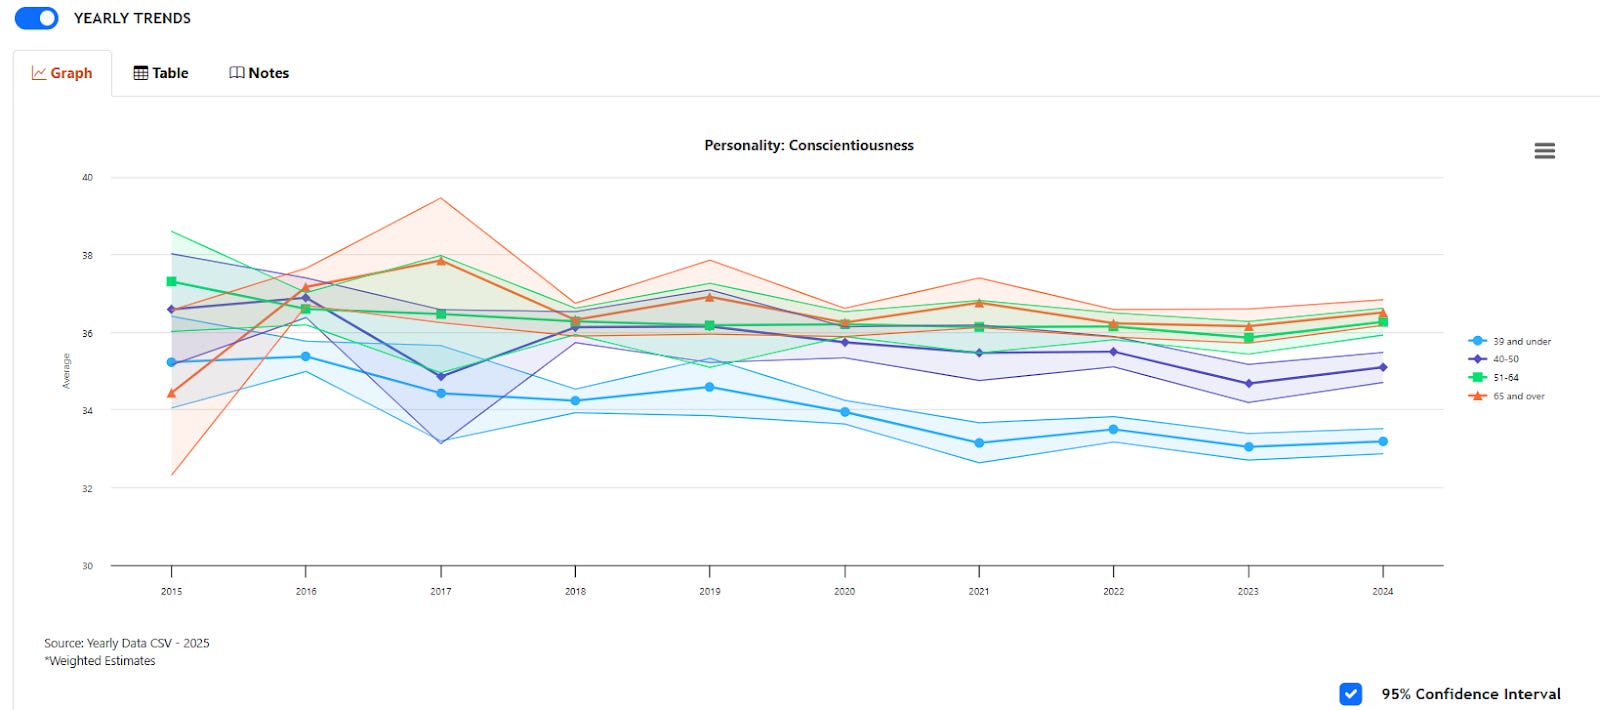
The way conscientiousness is measured is based on 9 questions that are scored on a 1 to 5 score (strongly disagree to strongly agree), giving a maximum possible score of 9 x 5 = 45. It is worth noting that the most recent estimates in 2023/2024 are both within the confidence interval of 2017 data, which may suggest that there hasn’t been any change in trait since 2017. This explains to me why the Financial Times did not show this – you can’t really see any change in personality from this data.
Interesting Reads from the Week
News: The US Central Bank, the Federal Reserve, cut interest rates by 0.25%. This was a bit of a contentious decision, as inflation in the US has remained high (at 3%). It appears that markets believe interest rates will need to be kept high to tame inflation, as long run interest rates on US treasuries have remained elevated.
Article: David Deming goes over his research on how people currently use genAI technology, and what types of tasks it may really be assisting with.
Article: Dave Deek goes over research on how parents insure their adult children from income shocks:
”Parents act as a powerful, informal insurance system for their adult children. When a child suffers a major financial shock, parents, who typically have twice as much savings, step in to help. This family safety net is so effective that it reduces the wider economic impact of personal income shocks by 27% to 43%.”
I think this shows that journalists are going more and more for clickbait value rather than reliable info that they understand and know how to convey to the reader. That's not really news, but always nice to throw shade on people who do it :D
Nothing makes one look old like saying, "Kids these days. They're lazy and don't show respect."