
A Reader’s Guide to Economic Headlines
With the media posting sensational economic stats daily, filtering out the noise becomes crucial.

Thank you for reading our work! Nominal News is an email newsletter read by over 4,000 readers that focuses on the application of economic research on current issues. Subscribe for free to stay-up-to-date with Nominal News directly in your inbox:
If you would like to support us in reaching our subscriber goal of 10,000 subscribers, please consider sharing this article and pressing the like❤️ button at top or bottom of this article!
Several of our recent articles touched upon the interpretation of economic data releases. In many instances, the news headlines on this data do not reflect what the data tell us. One of our readers asked about how one should approach interpreting data headlines, especially if someone is unfamiliar with the topic. Let me describe how I go about it, which may be helpful to you.

Deceitful Headlines
We often hear that you can come up with a statistic to justify any conclusion. One of the main ways this is done is by not giving any context to the statistic and just letting the reader infer a conclusion. Here is an example from ABC News:

Given that this is a headline, ABC believes it is newsworthy. But is it really? What is ABC trying to say? If you see this headline, you might conclude that the US economy is not doing well since people are becoming reliant on credit card debt. But is this true?
Let’s start by asking whether focusing on ‘total credit card debt’ is insightful. Suppose I have $1000 of credit card debt. Next year, I have $1100. My total credit card debt went up. Is this a problem? To determine that, you’d probably have to ask me how much income I have or how much savings I have. If my income went up by 20%, this 10% credit card debt increase is not a problem.
So maybe looking at total debt on its own does not make sense. How does total debt look in comparison to income (GDP – Gross Domestic Product is a good proxy for this). Let’s take a look at the chart that looks at household debt to GDP:
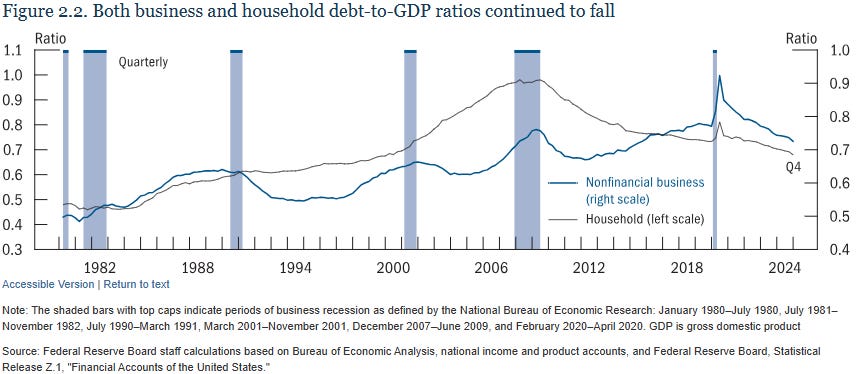
The current household debt to GDP level in the US is at a level comparable to 2000, and well below the highs of 2007-08, and even lower than pre-pandemic levels. Hmm – the ABC News headline now looks unnecessary.
Maybe the reason ABC News ran this article is because, today, interest rates are higher and thus, credit card debt may be less manageable. After all, what really matters with debt is whether you can pay the interest owed. Let’s see how the cost of servicing this debt is in comparison to disposable income (i.e. money after taxes/transfers):
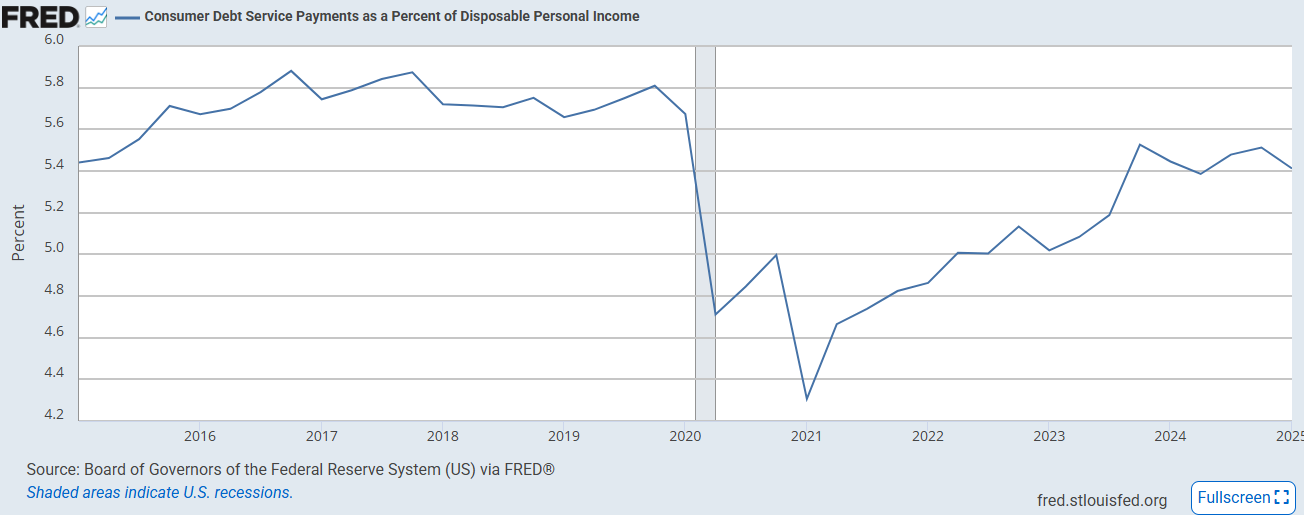
Again, the US consumer appears to be doing better than pre-pandemic. (Note, the lower levels of debt service payments to disposable income observed during the pandemic period between 2020-2023 was driven by elevated disposable income due to significant increases in government transfers.)
So, to me, the ABC News headline frankly had no merit. This was not a newsworthy fact to mention.
What to Look Out For
When a news piece citing data gets published, it is more important to pay attention to what the data metric is rather than the number itself. My first question is:
What can the metric tell us?
This is my immediate reaction to any data headline – why are we even looking at this data?
For example, if I tell you the height of a person, what can this number tell me about the person?
If we look at the total credit card debt headline from ABC, my first impression is “so what?”, as this number really cannot tell us much. Maybe total debt is related to how an economy is doing or if consumers are earning enough (higher debt could be due to wages being lower). But would I use the total credit card debt to figure out how the US economy is doing?
No. So, to me, this data point immediately feels ‘useless’.
After answering the above, I’d then look at the value of the metric and ask the following:
Is the value of the metric presented in an appropriate context and with other relevant data?
This question reminds me to always look at any data in context. For example, if we are to look at a person’s height, it would be helpful to know the person's age.
In the credit card debt example, the context given by ABC News is simply total credit card debt is the highest it has ever been. Is this an appropriate context?
If we think about what is important for measuring debt, income and wealth quickly come to mind. Moreover, other data such as wages, savings, ability to cover interest payments, as well as wider macroeconomic data like unemployment would be helpful. The ABC News piece ignored all these elements, which tells me that the context chosen by ABC News is not appropriate.
Even if the context is not correct, I ask myself one last question:
Hypothetically, what would we expect the value of this metric or data to be?
This question is meant to determine whether the reported data is actually unexpected. To give an example, if we are given a person’s height, we would typically think of the average person’s height as a comparison. Thus, if we say that person is 6 foot, we are not surprised and it is not newsworthy. It is often not as easy to answer in every context, but we can take a few steps.
With regards to the total credit card debt, we could try to compute the credit card debt per person and compare it to the average income per person. Normally, I would expect such an analysis to be done by the reporter/journalist. If such analysis is not presented, it is often because this additional analysis would make the headline seem boring – we actually should see total US credit card debt be at an all time high, as the US has seen recent population growth and has had significant inflation, meaning total credit card debt should be higher.
Thus, the fact that total credit card debt is at a record high is not only a meaningless metric on its own, but also it actually should be an all time high. If anything, if it weren’t at an all time high, that would be far more interesting, as it would imply people are saving much more than before (which often is a recessionary sign actually).
Healthy Skepticism
The purpose of these three questions is to help in filtering out poor analysis and meaningless headlines. Social media and news headlines often go for the dramatic rather than the insightful. I encourage you to approach data headlines with these three questions:
What can the metric tell us?
Is the value of the metric presented in an appropriate context and with other relevant data?
Hypothetically, what would we expect the value of this metric or data to be?
Or the more direct framing of these questions:
Why are we looking at this data?
Did the authors explain the data?
Is the data unexpected?
Next week, I will use these questions to go over a recent example published in the Financial Times, which argues that younger generations are becoming less conscientious with a dramatic headline:
Interesting Reads from the Week
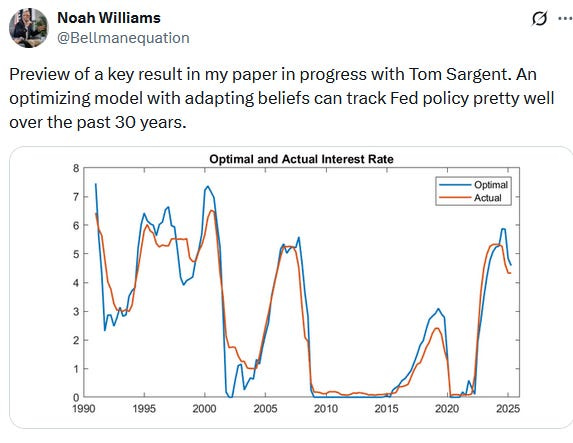
A new working paper (in progress) by some of the best macroeconomists basically shows that the Federal Reserve has been near perfect in the last 35 years:
Article: Matt Darling and Don Moynihan show how work-requirements (i.e. the need to demonstrate that one has worked in order to receive a benefit) have completely failed, even in states where a good-faith attempt on making them work was tried. We’ve discussed this topic at here: Work Requirements – An Ineffective Policy.

Thank you! That's a great tip regarding the word "total"
Nice overview! We should always be skeptical when seeing a metric that begins with "total."