


Nominal News is an economics newsletter written by a PhD Economist that translates the latest economic research into clear, policy‑relevant insights on current issues. Join 4,000 readers to stay-up-to-date with Nominal News directly in your inbox:
Recently, the media outlets have stated that polls have again missed certain US elections with a special focus on the Democratic primaries in Michigan and Wisconsin. Media outlets are even questioning the reliability of polls. Given that elections are a popular topic, I wanted to clarify how polls should be interpreted and why the media headlines, as well post-election analyses, demonstrate a serious misunderstanding of what polls are.1

What You’ll Discover Today:
The difference between a poll and a forecast;
Why focusing on polling margin is incorrect;
My rules of thumb for interpreting polls.
What Polls Actually Measure
The biggest confusion with polls is that polls are assumed to be direct reflections of what will happen on election day – if a poll shows a candidate ‘leading by 10%, then on election day the candidate should more or less win by such a margin’. This is incorrect – a poll is not a reflection or a forecast of what will happen on election day.
Polling Questions
A poll typically asks who would you vote for if the election were to happen today. Firstly, unlike an actual election, a poll is a low-stakes affair, and therefore people might not have fully considered what they would actually do on election day. Secondly, some people pick ‘undecided’ in polls. On election day, there is generally no such thing as an ‘undecided’ voter.2 Lastly, some people in polls pick non-leading candidates. On election day, they might change their vote to a leading candidate for strategic reasons.
Weighing the Sample
Once the pollster collects responses, the pollster then needs to appropriately ‘weigh’ the sample. That’s because the specific people that responded to a poll might not be representative of the group the pollster is trying to capture (for example, maybe too few young people responded in the sample).
But one question that arises – what group is the poll trying to capture – is it the general public or is it the people that will vote on election day? This is an important distinction, as it can change poll numbers significantly.
Poll Numbers
Once the pollster re-weighs the responses it got, the pollster publishes the polling numbers. Based on the steps above, the poll numbers are a snapshot of how the wider public (or voting public) feels about the election candidates at the time of the poll.
Election Day Forecasting
Instead of treating polls like a barometer, both the media and pollsters write headlines that view polls as if they are equivalent to what will happen on election day. For example:
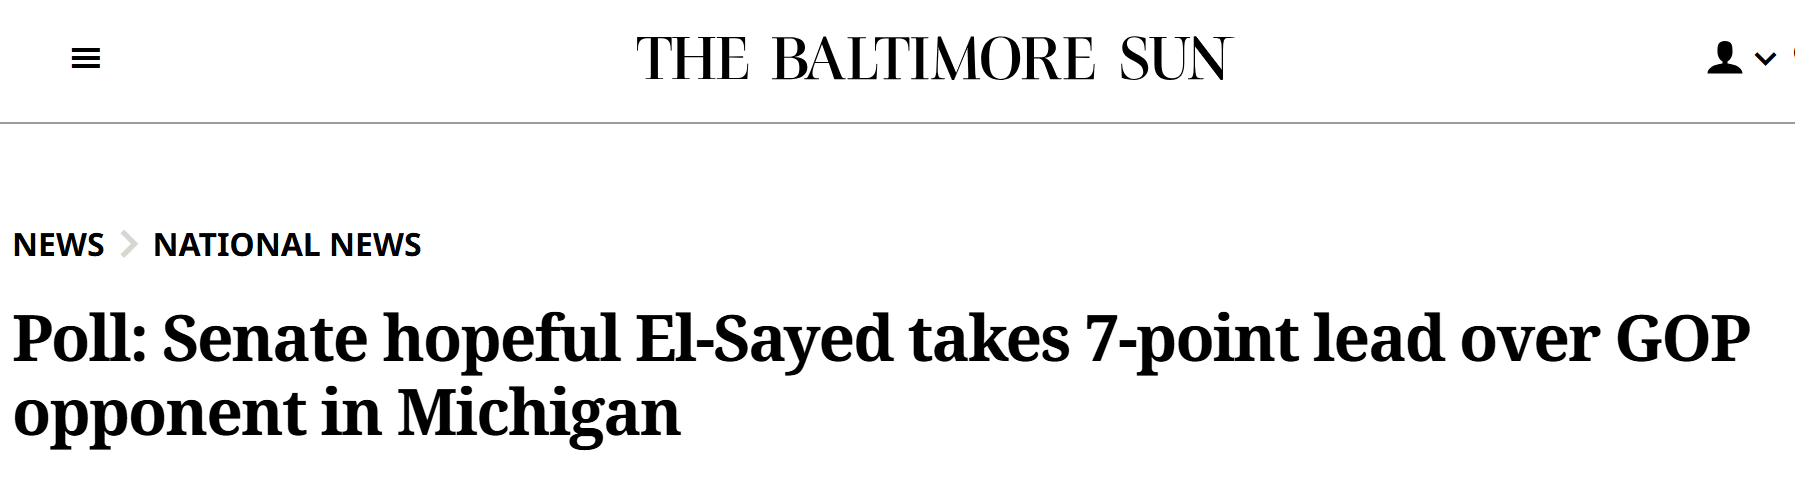
The above language implies a forecast of what will happen on election day and that a candidate, El-Sayed, is ‘leading’ by 7 points. This headline is especially nonsensical, as a closer look at the poll shows that one candidate has 46%, while the other candidate has 39%.
So what about the 15% of undecideds – what will they do on election day? The headline above assumes that they will split perfectly evenly between the two candidates. Do you think that’s a logical assumption?
Forecasting
This is where forecasting comes in. Forecasting is modeling what exactly will happen on election day. That means predicting how many people will turnout, which people will turnout, and how each of them will vote. Polling can help inform our predictions, but it is NOT a prediction itself. A poll should be an input into a forecast model, and not the model itself.
But the media (and even pollsters) present polls as a forecast. There are plenty of elements that need to considered for a good election day forecast:
Will everyone vote as they said in a poll? Will we see consolidation towards leading candidates?
Who are the undecideds and will they show up to vote?
Are any groups more likely to have a higher/lower turnout than typically assumed?
Between the current poll and election day, what will candidates do (election campaigning, endorsements, new policy promises, etc.)?
Examples
If we take the above poll and headline as an example (let’s simplify by assuming 100 voters):
Candidate A: 46% – (46 voters)
Candidate B: 39% – (39 voters)
Undecided: 15% – (15 voters)
Suppose Candidate A has a younger voter base, who are typically assumed less reliable to show up on election day. Let’s assume 3 of Candidate A’s voters do not go to the election. Next, let’s assume that, of the undecideds, 4 do not go to the election at all, while 8 vote for Candidate B and 3 vote for Candidate A. The election result will be as follows:
Candidate A: 46 votes (49.5%)
Candidate B: 47 votes (50.5%)
Candidate B wins the election. The media headlines will focus on “how did the poll miss this election”, as originally Candidate A was leading by 7 points, but saw an 8 point reversal.3
To belabor the point, let’s change one of our assumptions – suppose only 1 Candidate A voter does not go to the election. The result would then be:
Candidate A: 48 votes (50.5%)
Candidate B: 47 votes (49.5%)
Media headlines will again claim polling misses. But in both examples (and especially the second one), I hope it’s clear that the poll itself did nothing wrong. There was no polling mistake. The mistake was using the poll as a forecast!4
How I Use Polls
Hopefully the above clarifies how polling vs forecasting differs. Now, I doubt many of us have time to do deep dives and build our own forecasts. So here is how I quickly interpret polls for myself:
If polls consistently show a candidate getting above 50%, then the candidate is almost guaranteed a win;
If polls consistently show a candidate in the high 40s (47%+) and there are at least 6% undecided, the candidate has a very high chance of winning come election day;
Anything below 47% (regardless of “lead”) is unknown and would require a deep dive to forecast the outcome.
I know the above guidelines are very crude and probably could be refined more, but that’s for a different writer to analyze. Carl Allen , whom I recommend on this topic, put together a historic table for US elections, which shows why ‘polling leads’ often do not mean much. The table below presents how often a candidate with a given polling support level (first column) and polling ‘lead’ actually won.
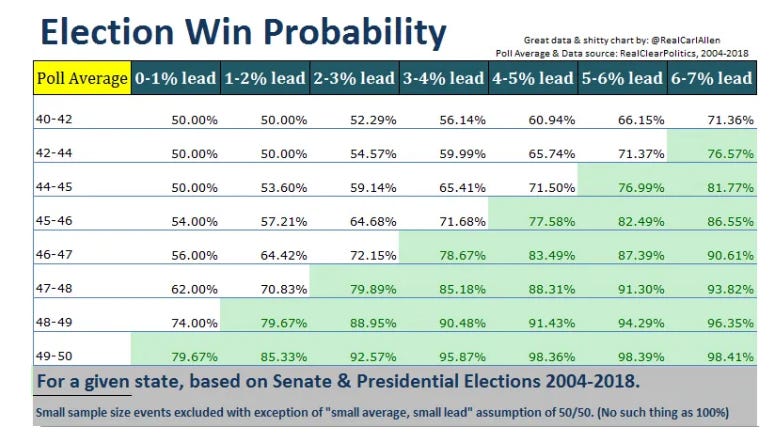
The conclusion one should draw from this is that ‘leading’ by 1% and having 49% support is better than leading by 7% and having 40% support – something that might seem counterintuitive.
In the appendix, I discuss two recent examples of alleged ‘polling misses’ and how I applied my rule of thumb.
Don’t Criticize Pollsters For Margin Misses
The point of this piece is to discourage criticism of polls by looking at polling margins. Polls are either conducted properly or improperly. They should not be judged against the actual results. These types of criticism also create incentives for pollsters to start targeting margin as the main metric rather than conducting a proper poll. And this may have actually happened recently, with a pollster adjusting results to more closely align with what they think will truly happen on election day:
TPSI [The Public Sentiment Institute] said in its ‘accuracy review’ of the survey that an error occurred after the firm applied an ‘experimental layer’ that applied previous survey results to the poll after its results ‘did not align with our read of the race’.
‘Acting on that conclusion, we identified respondents who selected [Florida Lt. Gov Jay] Collins but whose broader profile aligned with a competing [candidate], and leaned those respondents toward James Fishback’, the firm wrote in this document.
Just like pollsters, economists are also not in the forecasting business. We often get criticized, because our results ‘did not align with what happened’. As with polls, the real issue is misunderstanding what economists do and how to apply their work, not with the work itself.
Key Takeaways:
Polls are not forecasts, but rather data to be used in forecasts;
Polling margins are not meaningful without a deeper dive;
Focus on the level of support if you want to quickly judge a race.
Please let me know what you thought of the article length:
Appendix – Real Life Examples
Two recent elections restarted many of the polling-miss headlines – the senate democratic primary in Michigan and the governor democratic primary in Wisconsin.
Michigan
In Michigan, one candidate had a ‘polling lead’ of double digits, but in the end, the leading candidate won by 1 point. Here were the polls:

Using my own rule of thumb, as El-Sayed was polling in 50%+, I would say he was ‘guaranteed’ to win. Which he did. The fact that the result was ‘closer’ than the polls, simply suggests that undecideds split heavily in favor of Stevens.
Wisconsin
In Wisconsin, one candidate had an average ‘polling lead’ of over 15%. In the end, they lost by 0.5%. Here were the polls.

Polls had Hong in the high 30s/low 40s. Using my rule of thumb, I would not be able to say whether Hong would win or not without taking a deeper dive. Even if we use the naive5 historic trends, as in the table provided by Carl Allen above – Crowley had an ~1 in 4 chance of winning.
If you would like to support us in reaching our subscriber goal of 7,000 subscribers, please consider sharing this article and pressing the like❤️ button at top or bottom of this article!
You might wonder why I am writing about this. It’s because the mis-interpretation of polls is very similar to how results in economics are mis-interpreted.
A blank vote does not impact the outcome of an election.
To make it worse, the pollster will get a “D” rating, because it ‘missed’ the election.
It’s worth adding that the first scenario also tells us that Candidate A was never actually leading!
Naive here means simply using a historic average and not focusing on specifics particular to the election in question.
Thank you for this. I read the Marquette poll paper in Wisconsin and a few things struck me, that youve mentioned here: the undecideds, the emphasis on the poll being capturing a moment in time, and maybe some self selection happening. Like even within demographic categories I think Hongs voters were more likely to complete the poll. Anyways this is very interesting!
The example simplifying down to 100 voters is outstanding. Probably going to steal. Thank you.