


Nominal News is an economics newsletter written by a PhD Economist that translates the latest economic research into clear, policy‑relevant insights on current issues. Join 4,000 readers to stay-up-to-date with Nominal News directly in your inbox:
‘Greedflation’ is a contentious topic that rose in popularity during the inflation surge of the Covid pandemic. Many economics commentators have criticized the idea that ‘greed’ mattered for inflation during the Covid pandemic. But recent news on price collusion between egg producers, reinvigorated the debate around ‘greedflation’ as an important driver of recent inflation. Although collusion is an easy example of what many perceive as ‘greedflation’, recent research by two Federal Reserve economists suggests that there may be more to ‘greedflation’ than previously thought.

Defining ‘Greedflation’
One problem with the ‘greedflation’ debate is that the term itself is undefined.
Many economics commentators interpret greedflation as inflation that is caused by firms’ ‘greediness’ and often somewhat sarcastically argue that ‘when prices fall, firms must have gotten less greedy’.
I am not a fan of this definition. Unlike economics commentators, who do not view ‘greedflation’ and firm power as related, the public outrage about ‘greedflation’, appears to be focused on that firms may have too much power in dictating prices and that current competition levels do not sufficiently rein their pricing power in. Investigating this issue is something economists should do and many are doing. Did pricing power go up? If so – what could have caused it? Have competition levels deteriorated? Are firms better able to extract consumers’ willingness to pay? Is collusion up?
All of the above are valid questions, which I would capture under the umbrella of the word ‘greedflation’. Baslandze and Fuchs (2026) (“BF”) looked at one potential channel of pricing power – supply chain disruptions may have enabled firms to increase prices above their own increase in cost.
Covid Pandemic and Supply Chain
BF first built a model that focuses on two elements that may affect an importing firm’s decision on pricing their product – the cost of producing product and the likelihood of receiving the needed shipments to make the product.
A Simple Example – ‘Perfect’ World
To understand the intuition, let’s start off with a hypothetical ‘perfect’ world scenario of a basketball-selling firm that imports the basketballs. In this perfect world, the basketball firm always has a basketball available to sell if a customer wants to buy it. Under this scenario, the price the basketball firm would charge depends on the cost to import the basketball and how much people really want basketballs in comparison to other sports equipment (this is typically referred to as the ‘elasticity of substitution’). Both of these parameters – the cost and the ‘elasticity’ – are outside of the control of the basketball firm, so they set their price using these two external factors.
A Simple Example – Adding Shipping
Now, in a more realistic world, the firm would have storage costs to keep all the basketballs, and so the firm would have a limited stock of these basketballs. To replenish the stock of basketballs, the firm would rely on import shipments. If we assume that the firm sells 100 basketballs a day, and receives a shipment every month, the firm needs to receive 3,000 basketballs per shipment.
In normal times, since these shipments are predictable, the firm would de facto charge a similar ‘perfect world’ price, as in the example above.
A Simple Example – Shipping Delays
Suppose, however, all of a sudden shipments are delayed by 3 months. Now the firm is in danger of running out of stock, as it will sell its entire 3,000 basketball inventory in 1 month. In response to this risk, the firm may resort to increasing prices, in order to reduce demand for the basketball. Basically, the firm needs to now sell a third of the basketballs per day, or around 33 basketballs a day – and the only way it can make that happen is by raising the price. (I imagine that this behavior would often be called ‘greedy’ by the public).
A Simple Example – Adding Competitor Shipping Delays
BF alter the above model with another interesting element – how competitor shipping delays may influence the pricing. Suppose, there is another basketball seller in the market. Normally, the two basketball firms sell a combined 200 basketballs a day. Each firm also receives shipments in the exact same way – every month, 3,000 basketballs are delivered to each firm.
Now, just like in the above example, suppose your competitor gets hit by the 3 month shipping delay, but you actually do not get a delay. Since in a typical 3 month period, 18,000 basketballs get sold (200 per day as each firm sells 100 a day), due to the delay impacting one of the firms, there will only be 12,000 basketballs sold for the 3 month period.1 Due to this competitor delay, even though you yourself do not have a delay, you will also need to increase your price to such a level that about 133 basketballs are sold each day in total, as that is the only way the two firms combined do not run out of basketball before the next shipment. Thus, even though you were not directly impacted by the shipping delays, you may still raise prices.
The examples mentioned here are theoretical and aim to simply illustrate the mechanism in which one’s own shipping delays, as well as a competitor’s shipping delays, can impact one’s own prices. To test whether prices respond in this way and to what extent, BF test it with data.
Empirical Testing
Data Sources
BF used very detailed data that allowed us to observe quantities imported, import prices, as well as shipping/freight costs. Import quantities tell us about any shipping delays, as one would expect firms to maintain similar import quantities. Prices of imports and shipping costs are also needed, as we want to differentiate how goods prices respond to changes in production costs (unit import cost + shipping cost) and how much prices respond to shipping delays. Below is a graph that shows how the three things – delays, unit import prices, freight prices – responded during the pandemic. The values are normalized to 2019 – i.e. we are looking at deviations in these variables from 2019.
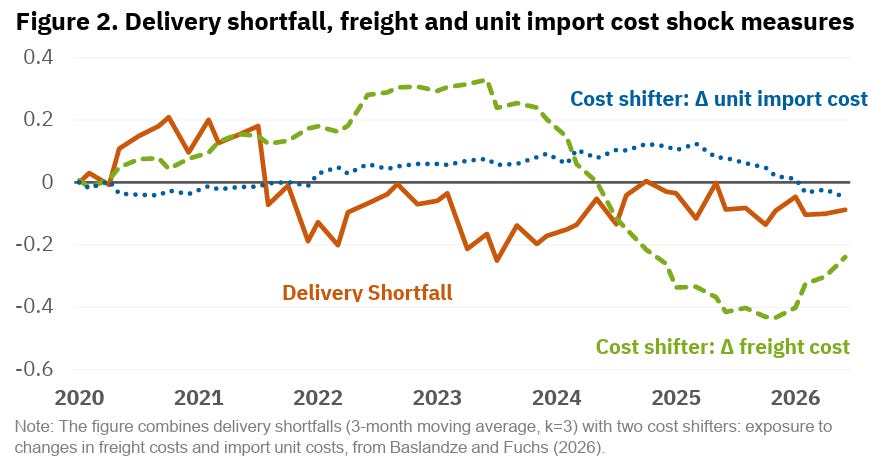
Delivery shortfalls (orange) in the two years from the start of the pandemic jumped up 20% – that is, import quantities dropped by around 20%. In 2021, import quantities started to stabilize. Unit import costs (blue line) moved very gradually and reverted back. Freight costs (green) also were very volatile, with a large jump till 2024, and a fall in freight costs since then.
How Did This Impact Prices
In order to estimate the impact of the above variables on the firm’s price setting, BF ran a regression. BF first looked at the impacts of how a firm’s price responds when the firm itself experiences an increase in delivery shortfalls or an increase in import cost. BF found that, in response to a 1% increase in delivery shortfall, a firm increases its price by 0.25% over the year. Moreover, the size of this effect is very similar to how firms change prices in response to higher import prices (for about 1% increase in the import cost, firms increase prices by around 0.2%).
BF then also estimated how competitor’s delays impact the pricing decision of a firm. The effect, somewhat surprisingly, was still large. To a 1% increase in delivery shortfall of its competitors, a firm increases its price by 0.1%, half the effect of its delivery shortfall.
What’s even more surprising, when BF looked at firms that do not import at all, if their competitors do import, the non-importing firms raise prices to all three effects as if they were importing!
Lastly, BF also looked at the data by focusing on goods sectors that saw higher overall inflation (compared to the average inflation). In sectors with higher inflation, firms more aggressively increase prices in response to delivery shortfalls – for a 1% increase in their own delivery shortfall, a firm raises prices by more than 1%! A higher inflation sector allows companies to increase prices more aggressively.
Putting It All Together
BF put all the findings together and looked at how prices specifically change when taking into account all the effects during the Covid pandemic.
In the chart below, on the left we see how much prices respond if we do not include the fact that firms respond to each other’s situations. On the right, these interactions between firms are included (shown by the lighter shaded areas).
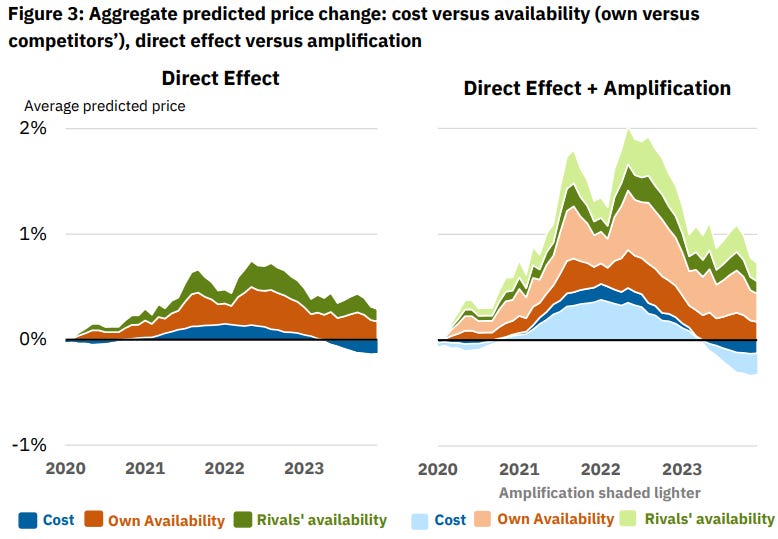
Without including the competitive interactions, we would be underestimating the impact of Covid-driven supply chain disruptions by half.
Is This Evidence For ‘Greedflation’?
The Covid pandemic caused significant global trade disruption. The BF research shows us how non-monetary costs (shipping delays) can feed directly into higher prices. Moreover, even if a firm isn’t impacted by the shipping delays, if a majority of competitors have shipping delays, they may still raise prices significantly. These interactions can help explain some of the rise in inflation post-Covid and the rise of the term ‘greedflation’.
It’s worth noting that the price hikes are strategically correct and firms have always been doing them, so their ‘greed’ didn’t change. Economists would therefore not use the term ‘greed’ or ‘greedflation’ to describe the hikes. But, the mechanism described above would fit in with price increases that consumers may find ‘unfair’ and thus refer to it as ‘greed’.
Moreover, since economists haven’t really considered shipping delays as an important source of price increases, our current beliefs about appropriate levels of market competition may be incorrect. For example, if economists previously thought that a market with 4 firms is a competitive market, once strategic pricing behavior regarding shipping delays is included, the market may need 5-6 firms to be competitive.
Regardless of what we call it, studying these interactions is crucial, as the impact on prices and general inflation of such supply disruptions can be large. Prior to the Covid pandemic, to the best of my knowledge, we did not have such research that looked at both direct supply disruptions (one’s own shipping delays) and indirect supply disruptions (competitor shipping delays). In part, due to the fact that the public started using the term ‘greedflation’, economists appear to have intensified research on strategic firm interactions and competition (like the research by BF). Unlike economic commentators, economists actually do listen to public dissatisfaction and investigate it rather than dismiss it.
If you would like to support us in reaching our subscriber goal of 7,000 subscribers, please consider sharing this article and pressing the like❤️ button at top or bottom of this article!
You received 3,000 basketballs in the first month, 3,000 in the second and 3,000 in the third month. Your competitor only received 3,000 basketballs in the first month, giving a total of 12,000 basketballs available for sale in the three month period.